In the US, bike trips increase 37% from 2019 to 2022
A new study shows just how big the pandemic-driven increase in cycling was, and shows that participation has remained high in 2022
James Howell-Jones
Junior Writer


© GCN
A new report from StreetLight Data has shown that bicycle trips in the US have increased by 37% from 2019 to 2022, with the pandemic prompting what the authors describe as a “watershed moment for bicycle activity”. The study, which broke the data down from the biggest US cities, showed that across the country, the increase in participation inspired by the pandemic has remained intact in 2022.
© StreetLight
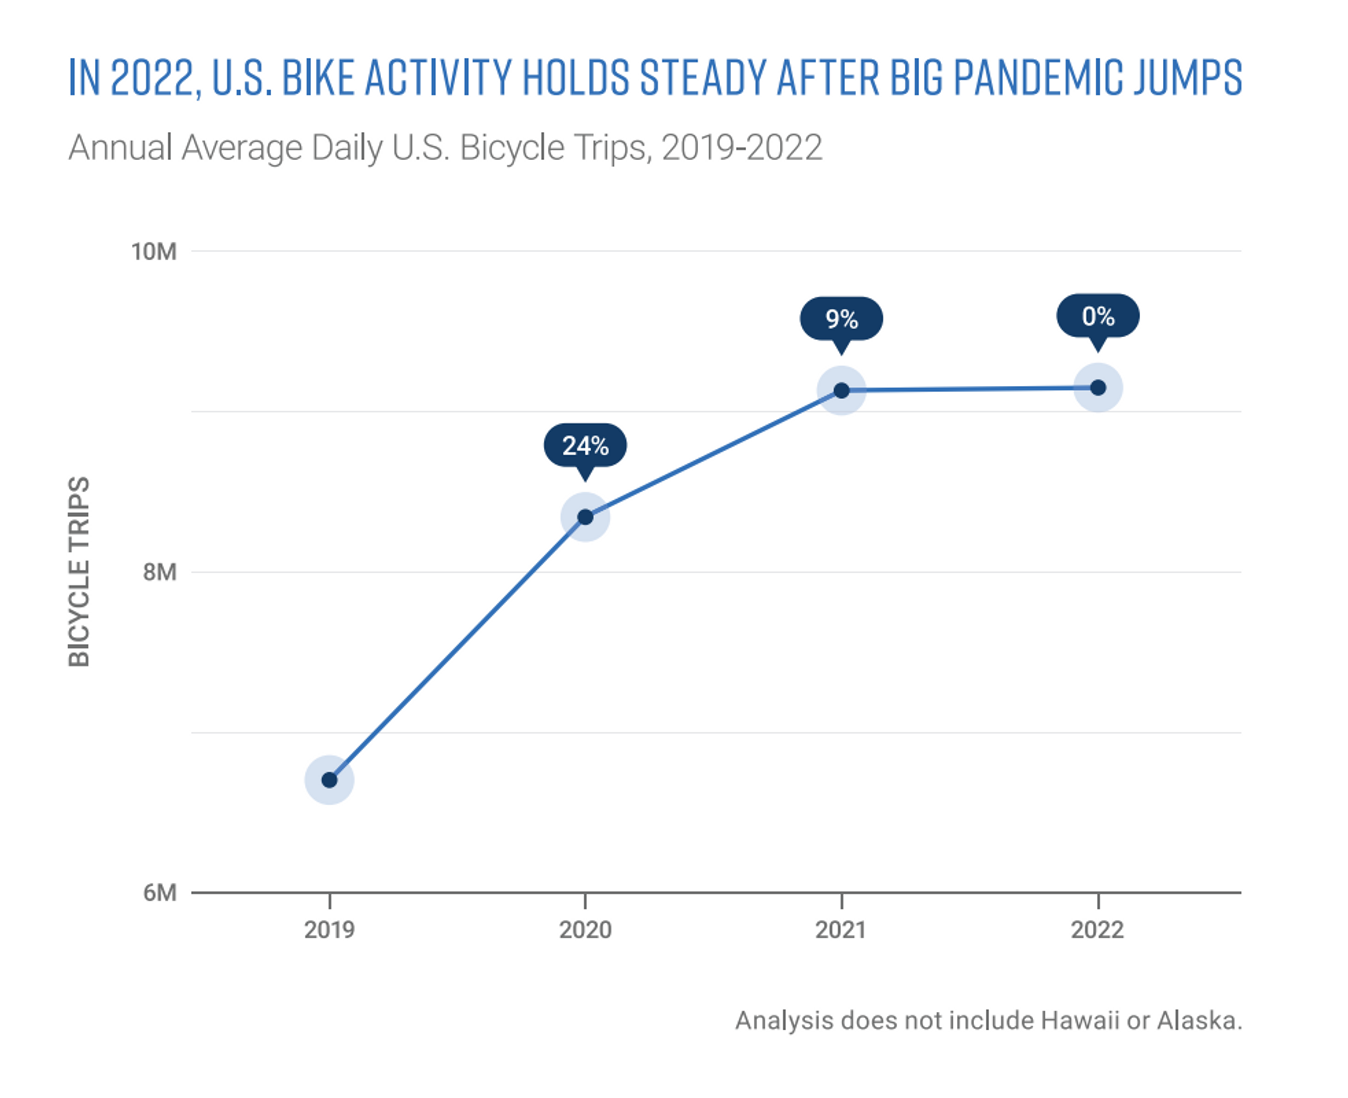
StreetLight's data shows the growth in cycling trip numbers across the US
After a dramatic rise at the beginning of the COVID-19 lockdown, the increase in the number of bicycle trips in the US has slowly levelled off. Between 2019 and 2020, there was a 24% increase in the number of trips taken by bike. Between 2020 and 2021, there was a further 9% increase, and between 2021 and 2022 there was a 0% increase.
The growth curve has levelled off, and only time will tell where cycling goes from here. As the report points out, given the extent of the increase in trips during the pandemic, it’s impressive that the growth remained steady in the first year post-pandemic.
Next year, though, is an unknown. The authors of the report suggest that, if we want to see this growth continue, we need to invest in infrastructure that improves the safety of cyclists: “The flat line in 2022 is a warning that continued investment in safety-focused active transportation infrastructure — especially to support community connectivity, in addition to recreational access — will be critical to re-animating growth.”
Read more:
Within cities, the increase is even more impressive
The increased number of cycling trips was driven in the main by the largest cities in the United States, that represented 77% of all bicycle trips. The increase in trip numbers in cities was vast during the pandemic, but many cities have seen a contraction in cycling in 2022.
Between 2019 and 2022, within the top 100 cities by population size, the number of annual daily cycling trips increased 46%. Again, the majority of this increase came between 2019 and 2020, during which time every city with a population of 5 million or more saw at least a 25% increase in average daily bicycle trips.
However, in many of the 100 cities studied, there are signs of the beginnings of a contraction: “In a warning sign for the continued strength of biking activity,” write the authors, “65 out of 100 metros saw annual average daily bicycle trips contract in 2022 YoY.”
For six cities, there has in fact been an overall reduction in cycling participation between 2019 and 2022, although the authors say that this is because these cities had a disproportionately high number of trips pre-pandemic in 2019, so less room for growth during the COVID-19 bike boom.
Where does the data come from?
The survey data comes from StreetLight Data, a transport data provider that uses hundreds of sources, including commercial and personal GPS devices, to spot trends in transportation.
Latest Videos


Related Content

36 athletes from 11 countries form Refugee Olympic Team for Paris 2024
The IOC Refugee Olympic Team will represent over 100 million displaced people at the Paris Games
.jpg?w=600&auto=format)
England Active Travel £225m budget cut challenged in court
Campaigners say 65% cut to walking and cycling budget is illegal

The free speed nobody is talking about – The GCN Show
Are you an efficient cyclist? Dan and Si talk about how to ride smarter, not harder, plus all the usual GCN Show features
‘Shocking lack of progress’: Charity criticises UK government for latest active travel figures
Findings in the latest Active Lives survey point to growing inequality, while cycling participation continues to plateau